
De-mystifying Gantt Charts
A Gantt chart should always be used to support and improve the management of your projects. Modern Gantt charts can handle complex actions with efficiency and click-and-drag simplicity. A Gantt chart packed full of easy-to-use features, and forming part of a complete project management solution, will provide a management tool to support all operations.
What is a Gantt Chart?
A simple to-do list in Excel may be sufficient for completing daily tasks or small projects around the house, but when it comes to effectively managing more complex projects, a detailed plan of action is usually needed. One of the most popular and practical ways to manage the timing of all tasks of a project is to use a Gantt chart.
A Gantt chart is a useful way of showing what work is scheduled to be done on specific days. It shows all the tasks that need to be done on your project, the amount of time each task is expected to take and the relationship between the various tasks. Project management solutions that integrate Gantt charts give managers visibility into team workloads, as well as current and future availability of the team, which allows for more accurate planning.
In other words, a Gantt chart is a simple way to communicate what steps are necessary to deliver a project on time and to budget. That means it’s a whole lot easier to keep your project team and stakeholders on the same page from start to finish.
Definition
As defined by the Association for Project Management (APM) ‘A Gantt chart is a project management tool assisting in the planning and scheduling of projects of all sizes, although they are particularly useful for simplifying complex projects. Project management timelines and tasks are converted into a horizontal bar chart, showing start and end dates, as well as dependencies, scheduling and deadlines, including how much of the task is completed per stage and who is the task owner. This is useful to keep tasks on track when there is a large team and multiple stakeholders when the scope changes.’
It is also sensible to use a Gantt chart for even the simplest projects, and particularly if there are multiple projects being undertaken. Not only will it provide visibility of all activities taking place, but it will also enable better planning of future tasks, impact to resources, budgets, procurement, and risk.
Example of a Gantt Chart
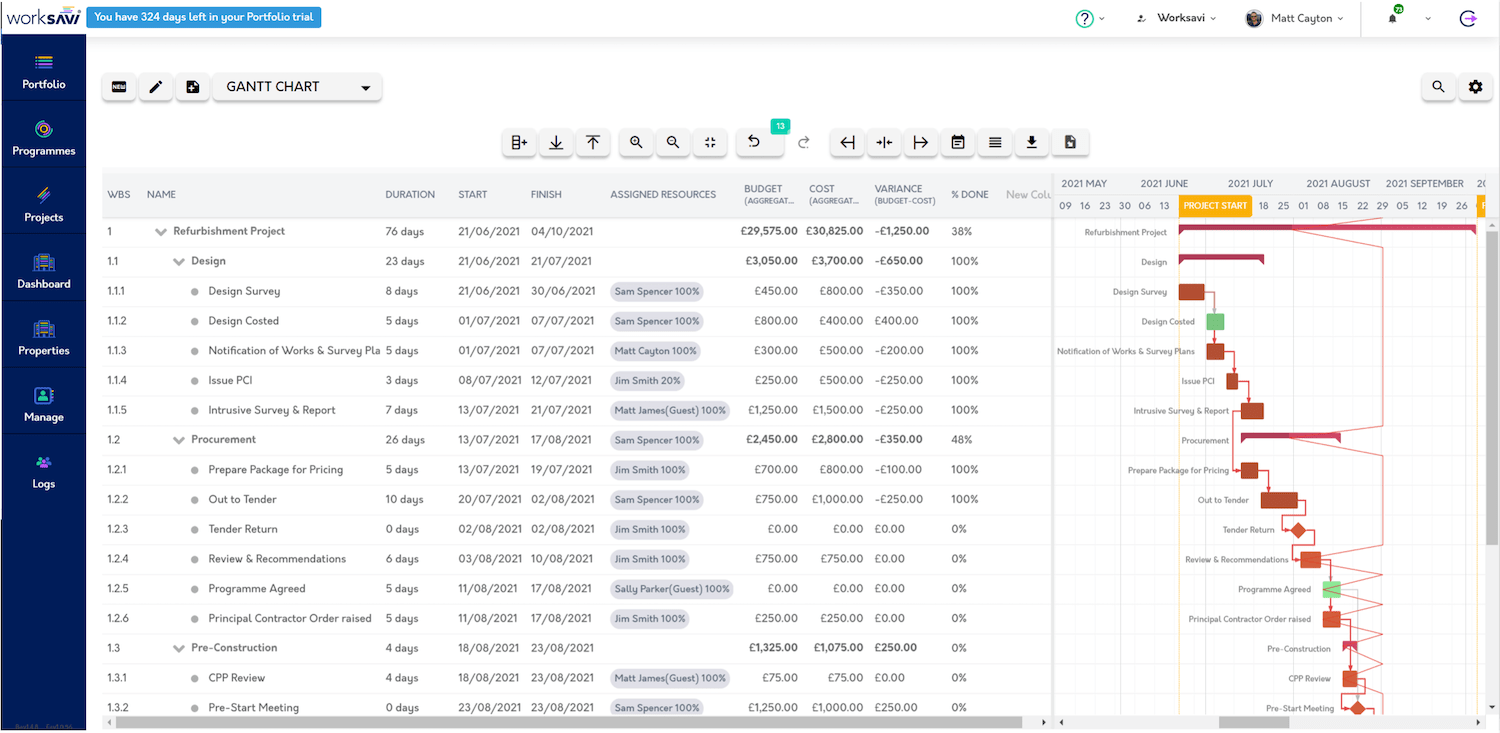
On a Gantt chart you should easily be able to see:
- A visual display of the whole project
- The start date of the project schedule
- How the project breaks down into tasks
- When tasks start and finish
- How long each task will take
- Project phases – how tasks group together under summary tasks, overlap and link with each other
- Task dependencies and the critical path of your project
- Milestones for important meetings, approvals, or deadlines
- Which team member is allocated to which tasks
- How work is progressing on the project
- The finish date of the project
How to use a Gantt Chart
To create your Gantt chart, you need to understand all the individual tasks required to complete the project, an accurate assessment of how long each task will take and which tasks are dependent on others or cannot start before a fixed date. It is also necessary to identify which tasks can be done at the same time and which can only be done sequentially. This will help the team to complete them in a timely and efficient manner. If we combine this with resource availability, we can assess the pace at which the project can be delivered against acceptable costs, by using more or less resources. By increasing resource or reducing the scope, the project manager can see the effect on the end date.
Suitable Gantt chart software should provide the ability to present different scenarios by increasing or decreasing resources to visualise the impact on your projects and allow you to follow the optimum workflow.
The very process of pulling this information together helps a project manager focus on the essential parts of the project and begin to establish a realistic timeframe for completion.
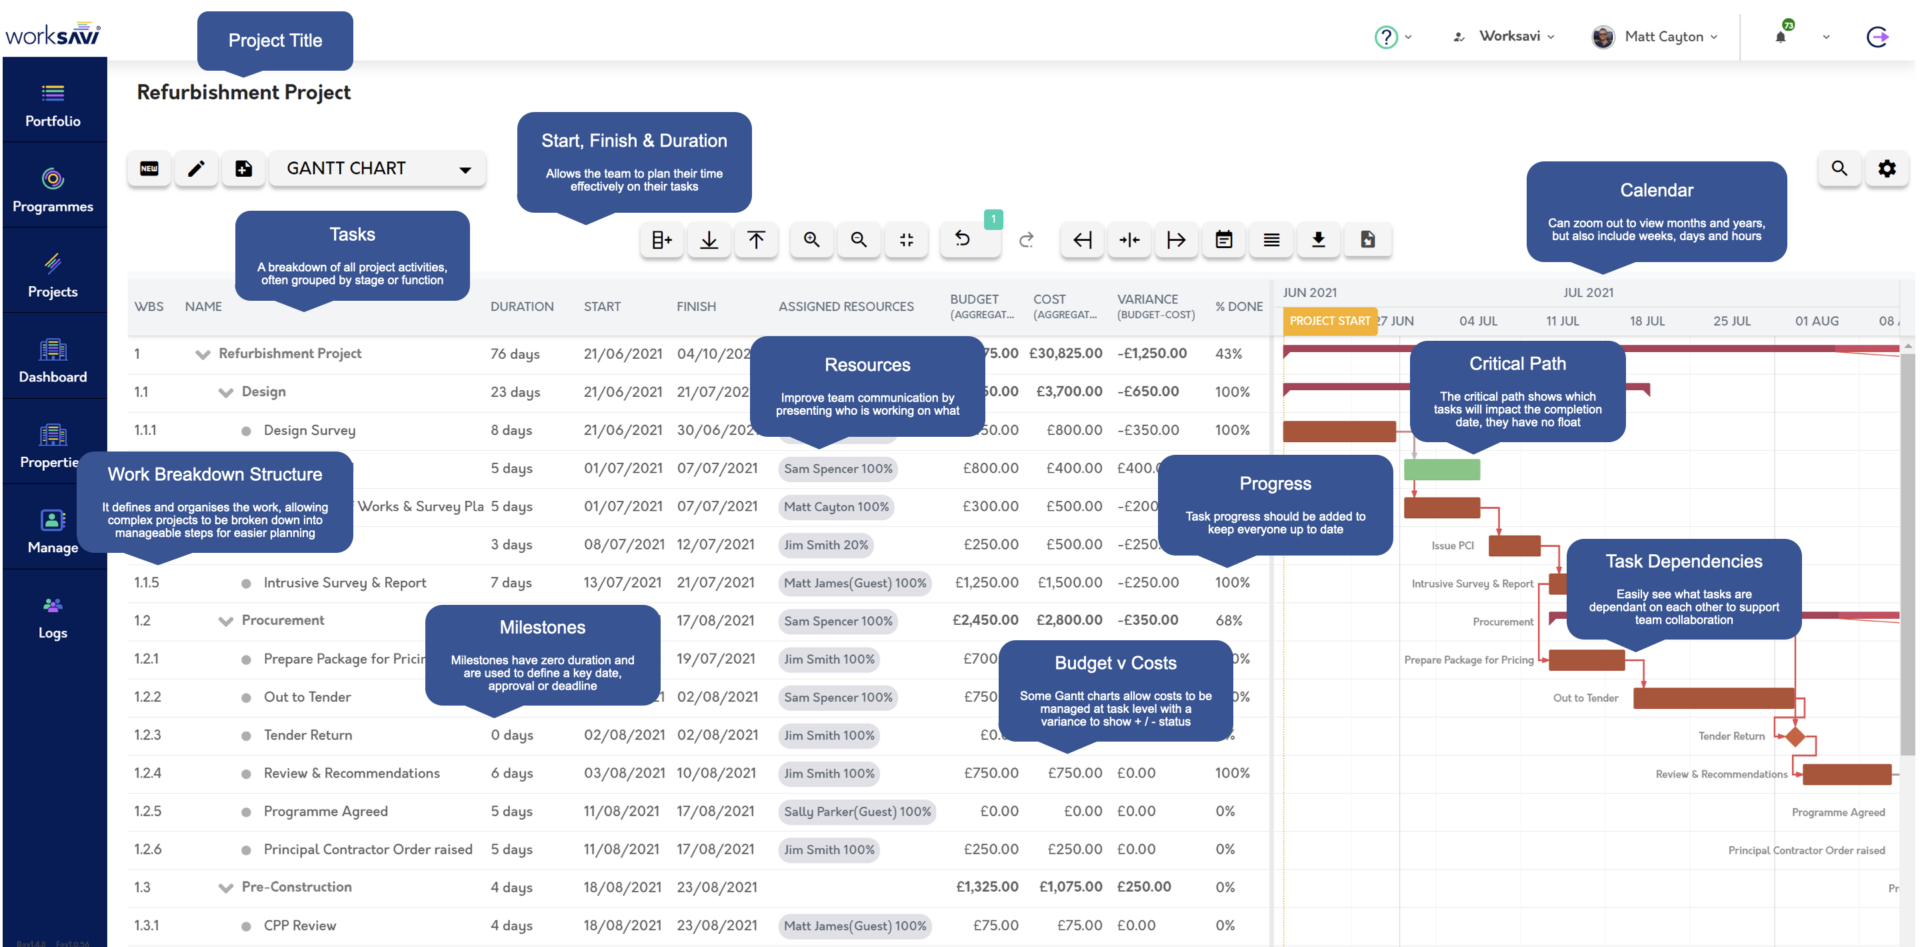
On first glance, Gantt charts may appear a little complicated, but once you understand the basic principles you will find them invaluable as they will guide you towards successful delivery across all of your projects.
The following Gantt chart image has been annotated to show you some basic terminology and how key elements of the plan function. Click to enlarge:
Project Templates
Businesses may follow similar repeated processes in the delivery of many of their projects. Rather than having to recreate the same project workflows on all projects a Gantt chart should have the capability to store project templates that can be adopted multiple times. Not only does this save time for the project manager, but it also ensures that the correct process and governance is followed.
When following similar repeated processes that are being closely managed and monitored, opportunities for process improvement become standard operation. Through regular progress updates, steps in the process are highlighted that do not perform or proceed as planned. Common repeated issues demonstrate a weakness in the process that needs addressing, maybe not enough time has been allowed, or too much time! Perhaps the person responsible does not have the correct skills to deliver the tasks effectively. Whatever the reason, measures can be put in place to improve the steps in the process. Capturing this learning will allow refinement and improvement of processes and strategy for future projects. Constantly learning, constantly evolving.
Plan | Create | Evolve
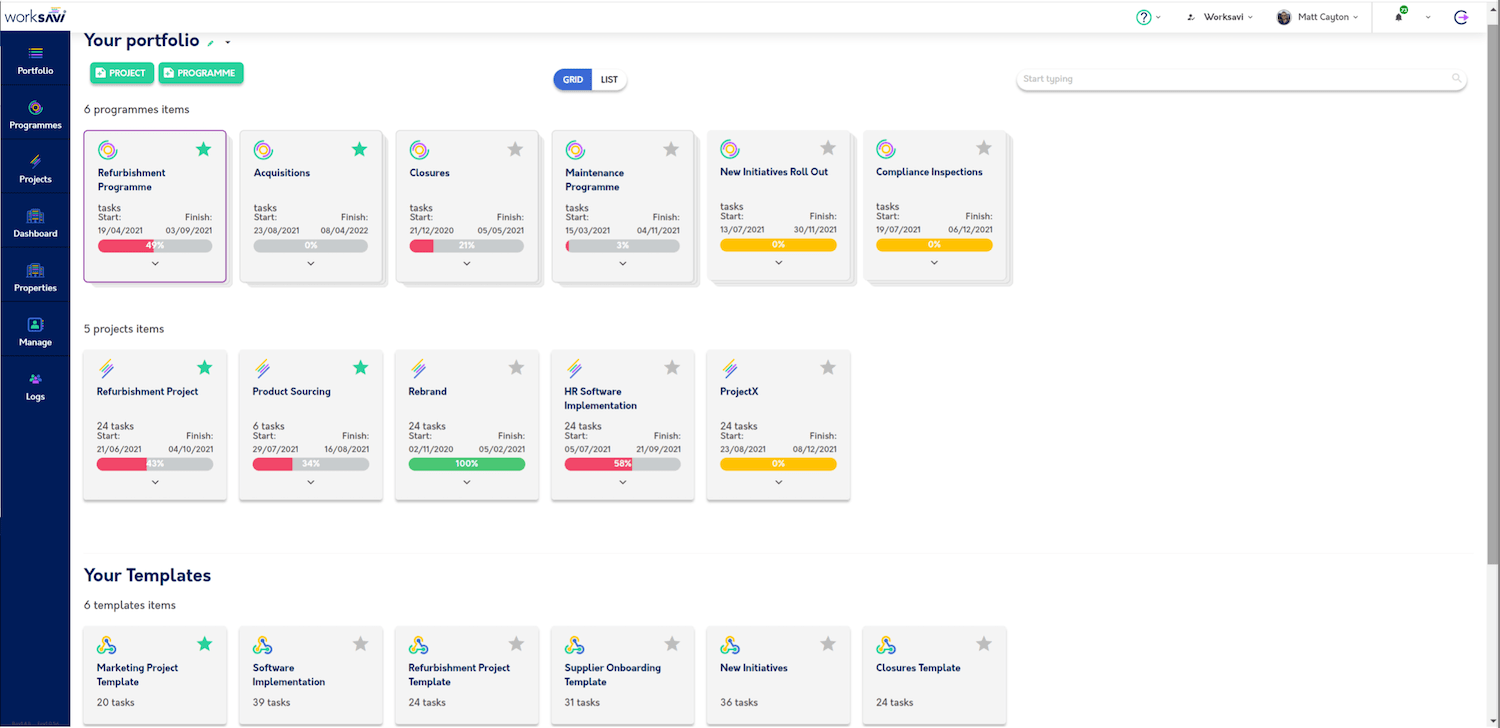
With WorkSavi, your project templates are stored at the bottom of your portfolio page, see following image. Select the relevant template and the Gantt chart will pop-up for that process allowing you to rename it and set a start date for your new project.
In the portfolio view, templates can be adopted to create projects. The templates can also be applied to multiple locations at the same time to automatically generate multiple projects, or a programme in literally a few seconds. This is particularly useful if you are undertaking the same project type across different properties in your estate or procuring multiple products or assets for example.
Projects are saved in the middle row on your portfolio page and programmes are accessed from the top row.
Key Features of Gantt Charts
Most modern-day Gantt charts are run on intelligent cloud-based project management software tools that help teams plan projects of varying complexity and size. Original Gantt charts were drawn on paper, then became very complex pieces of software, but the online versions today should be simple to use and allow teams to stay on top of their project planning, making easy adjustments when needed. When you shift a date or move a milestone, your Gantt chart should automatically reschedule the tasks to reflect those changes, so you can stay up to date on the latest project status.
Creating and adjusting task durations should be a simple matter of a click and drag with your mouse. Likewise, adjusting the progress on a task, assigning resources and costs is just as simple.
Task Dependencies
In addition to visualising start and end dates for each task, Gantt charts make it easy to map the dependencies between tasks. In some instances, you cannot start a certain task unless another task which is dependent on the former is completed. Such task dependencies can make things difficult to manage, especially in the case of complex projects, so it is important that you can easily see what each task is dependent on for the smooth running of your project.
With Gantt chart software it should be possible to draw task dependencies with click-and-drag simplicity. With dependencies, team members can easily identify who is waiting on their work before others can get started (and who to chase if things start running late!) and, if you need to push work back or bring work forward for some reason, you can identify any problems and shift dependency conflicts before they start.
Real-time Project Progress
As the project evolves and progress is added to tasks a simple reschedule of Gantt chart based upon the current progress status will forecast any impact to the original completion date. Keeping up to date with progress regularly is very important as it will highlight any issues as soon as they start to occur, allowing more time to consider improvement plans. Alternatively, if the project is progressing ahead of the planned dates there may be an opportunity to bring later tasks forward, but that will also need to be managed in terms of earlier requirement of resources, perhaps material purchases, or supply chain requirements.
Also, different scenarios can be applied to a project to assess the impact that certain decisions may have to performance. All options can be analysed before settling for the optimum solution based on time, cost and resource capability.
This makes it easier for teams to plan, collaborate and get great work done.
Resources
Suitable Gantt chart software will demonstrate how much time and person-power you need before your project commences, so you can allocate resources and schedule dates accordingly. No longer does resource management need to be a guessing game as you will be able to see who has capacity to take on more project activity and where there may be others whose work has been over allocated.
Project teams often need to plan tasks and manage resources across multiple projects and different teams. It’s therefore important to make sure your Gantt chart can support resource management, workload management, and task management across multiple projects in multiple locations.
It is important that the names of the people who will be working on the projects, if completed by a number of individuals, are assigned, rather than the role description. Assigning individual names to each task helps you effectively manage people, tools, and skills to complete each project on time.
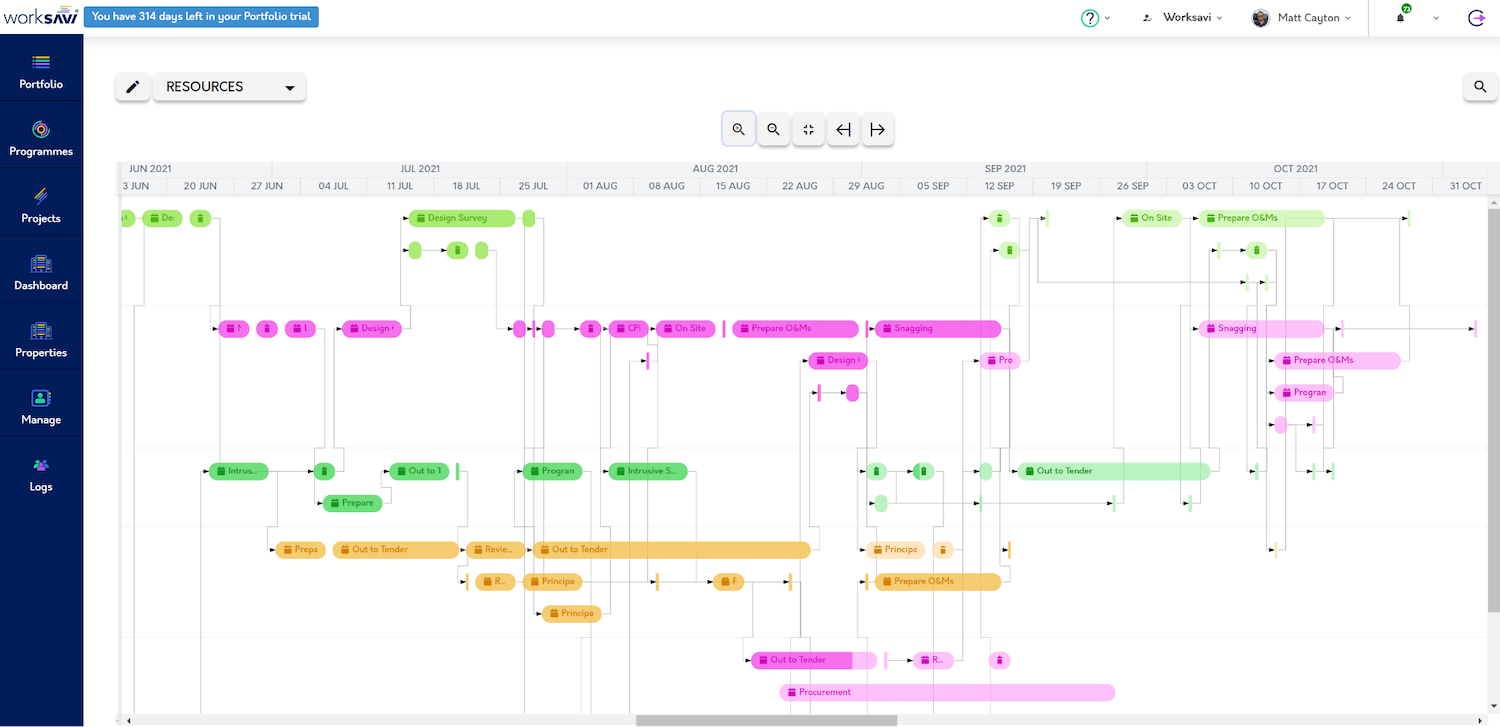
Using the WorkSavi Resource Calendar you can see all activities from multiple projects that are assigned to your team members. Immediately you can see if tasks are stacking up, which will create challenges for the individual, conversely where there are gaps in activity additional tasks can be applied or reallocated from someone who has too much going on.
In the WorkSavi Resource Calendar we have retained the task relationships from the Gantt view. Any shift in tasks now will immediately show the impact to the successor’s tasks further down the workflows giving greater opportunity to plan for the impact. Often opportunities are missed where activity is completed early, due to insufficient visibility. By seeing the impact earlier, individuals can better plan their time and any information or materials, for example, to be available sooner.
The Resource Calendar easily allows you to delegate tasks and reallocate by clicking on the task and dragging onto another team members lane. This way you can effectively and easily manage resources, and when resources are properly managed, projects are more likely to be completed within budget and to plan.
Milestones
Milestones are key features of Gantt chart projects. They identify major events, key decisions required or when key sections of a project are due to start or finish. By creating a Milestone view or filter in your chart, it will also provide at-a-glance insight into the whole project’s key dates. Milestones have zero duration, they are distinct points in time, unlike the other tasks in a Gantt chart which will appear as horizontal bars that span a duration of time.
Project managers and project teams should always have clear visibility of the project’s milestones. On the WorkSavi Gantt chart a filter can be applied to only show the milestones and on the dashboards, countdowns to the milestones can be created across all projects so that on a daily basis the team is well aware of how long they have left to complete their part in the key elements of the project.
Baselines
Modern Gantt software allows the user to create baselines at the beginning of a project. When the project Gantt has been created and all parties have agreed to their elements, a baseline can be created. When a baseline is set each bar in the Gantt is replicated, usually by a thinner bar underneath the main task. The baseline bars are fixed, so any future shift of the associated tasks during the course of the project is very visible and can be easily tracked.
Multiple baselines can be assigned to a project. This is usually necessary if there has been an approved change to the project that has impacted the flow and / or duration of the tasks. A new baseline would be set at the point of approval so the project can be monitored against that change.
Advanced Features to look for in a Gantt Chart
A Gantt chart suitable for managing multiple projects should form part of a complete project management solution. For optimum performance look for these features:
- Multiple project views, including Resource Calendar, Kanban boards, Trackers and Task lists
- Team collaboration
- Cost management
- Workload management
- Project forms for risk management etc and business templates
- Integrations
- Powerful dynamic reporting across all areas listed above
WorkSavi has all of these great features plus many more.
