
Google Data Studio
Get Savi Now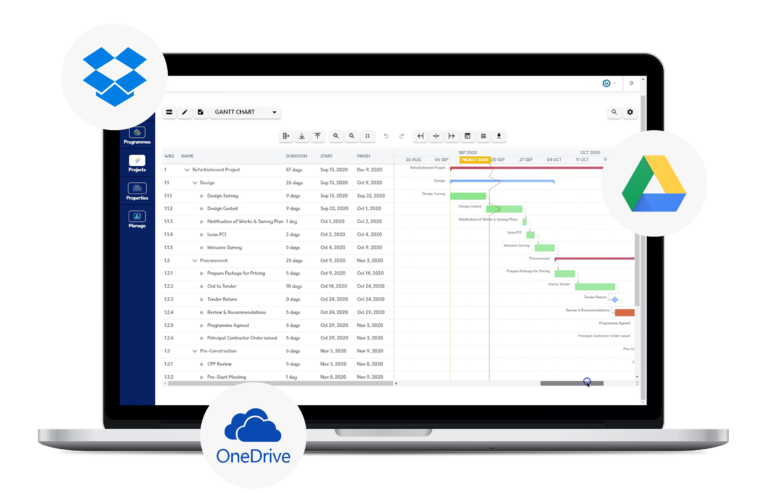
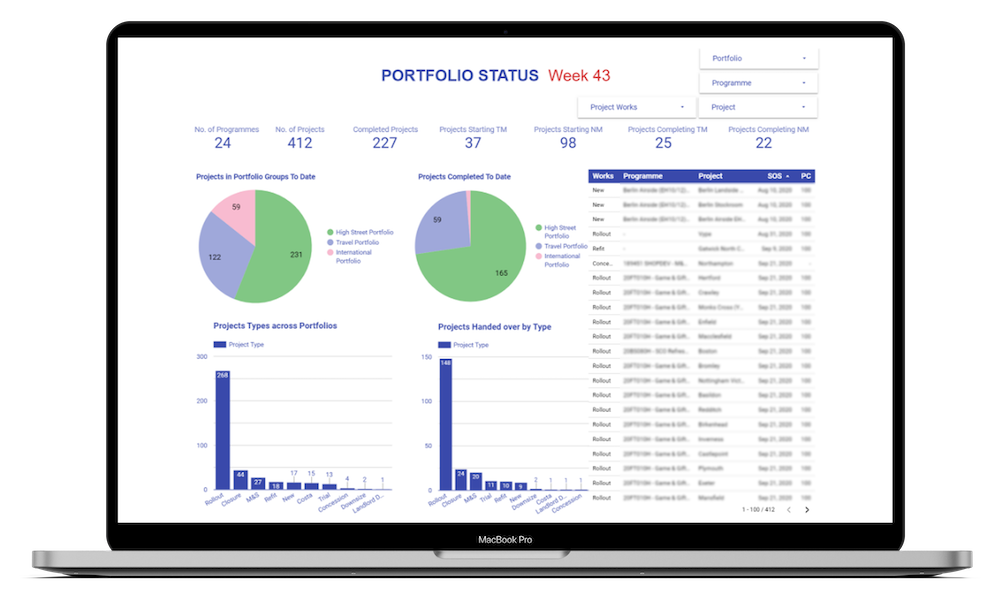
WorkSavi has created a full integration with Google Data Studio!
This means that dashboard widgets can be created with a drag and drop from any of the fields that exist within the WorkSavi portal. This includes, but not limited to:
- Programmes – Benefits realised / resource & supply chain utilisation / cash flow
- Projects – Counts / look-aheads / progress status / performance / baselines
- Task names – Start and finish dates / durations / % complete / all custom fields
- Resources – Names / allocations / workloads / under or over utilisation / skills
- Costs – Estimates / variations / total funding / costs / forecasts / analysis / over spend & underspend / supplier & package costs
- Risk – Categories / high risks / mitigations / action owners / close out
- RAID Forms – Actions, issues and decisions presented and prioritised
- Change – Change control, managed fields, impacts, approval status
- Property – Lease / rents / insurances / rates / compliance / assets / revenues v costs
- Property – Lease / rents / insurances / rates / compliance / assets / revenues v costs
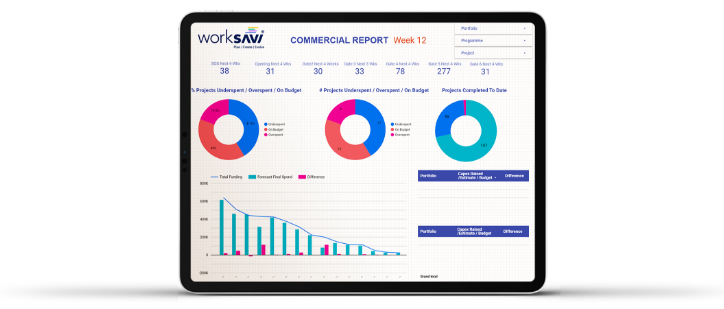
Dashboards and business reports are typically created in products like Excel or Google Sheets, and whilst spreadsheets are powerful reporting and analysis tools, if you don’t present the results in a simple and understandable way they can become a numbers dump and one dimensional. In short, they might make sense to you, but not your stakeholders.
Visuals make it easier to showcase your important KPIs, but with the above mentioned systems, this can be extremely time-consuming. There are tools, however, that make it easier. One such tool is Google Data Studio.
The benefits of Google Data Studio
The major benefit of Data Studio is that it’s extremely user-friendly and Google has a ton of tutorials to help you create comprehensive reports.
Like a spreadsheet, you can also do calculated metrics and dimensions. For example, if you want to see all tasks assigned to you over the next 2 weeks, including any late tasks, you can create a formula for that in Data Studio.
Unlike Google Analytics, which only allows a maximum of 12 graphs or charts in a report, Google Data Studio lets you include any number of widgets. This feature allows you to share and explain your data in multiple ways. Widget options include:


And many more!
You can also modify each of these widgets with a variety of metrics. With Google Data Studio, you have immense freedom in how you create your reports and convey your data. That’s why Data Studio is becoming an essential tool for companies.
In addition to the above, Google Data Studio reports are also:
- Interactive
- Fully customisable
- Come with pre-built templates
Another major benefit is blended data. With a blended data source, you can create charts from several different data sources. This could include data from a finance or CRM tool for example. That means you can pull and pool data from several critical platforms. A few examples include:


And many more!
Use these platforms to create a report that looks at all aspects of your business. This feature makes Data Studio a one-stop shop for your reporting needs and ensures your reports look incredibly professional.
How to automate reporting in Google Data Studio
The way that Data Studio works is that it connects to your data sources and automatically pulls in your data, without you needing to remember to refresh. You can also do all of this in real-time, meaning you’ll get the most up-to-date data possible.
Once your reports are setup, you don’t need to worry about manually updating the data. The connectors will continually refresh your metrics and dimensions.
Data Studio reports are also easily shareable. You can assign users permissions, allowing them to view or edit your reports in the same way you would for Google Docs, Sheets, and Slides – you can share a link and allow others to view and customise your reports.

Even better, this feature lets you make changes in real time while sharing. Your entire team can look at the same report and make changes simultaneously. This shareability aspect is a massive time saver for businesses and marketers!
Create easy-to-read reports for everyone
You can break down your reports into one page or 20 pages, demonstrating the flexibility and customisation of Google Data Studio. It adapts to your company’s unique needs, making it a stress-free process to share critical data.
While you can make edits with your team in real-time, you can also pull real-time data into your reports too. You can set your reports to update and fill your widgets with in-the-moment data automatically as well. Every piece of your report is customisable too.
If you want a few widgets to display current information you can, but you can also keep some data set to last month if you want. This dynamic report gives you unlimited data options to better serve your business.
